

Many documents over the years have offered guidance on how to perform or interpret spirometry and yet despite this it is still an area of much confusion and controversy. A guide to performing quality assured diagnostic spirometry1 was the first overarching document by key stakeholders to outline the minimum requirements for performing spirometry. The section consisting of the ‘top ten tips’ was published to suggest ‘how to’ look at a spirometry trace and check if it is appropriate for interpretation. The remainder of the document is advisory as to the standards for equipment, verification, cleaning and an overview of how to undertake spirometry. For those new to this subject is should be their ‘how to’ guide.
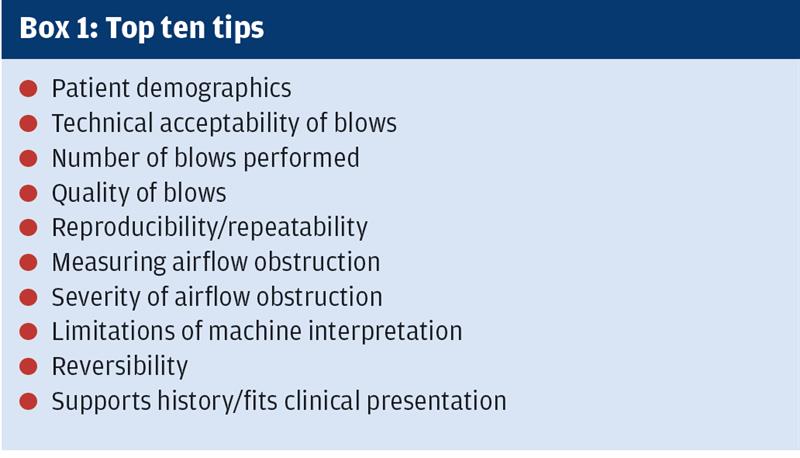
As the author of the original top ten tips, and having used them frequently for training sessions, it was apparent there were elements of them that were no longer current and needed to be revisited. Most machines now utilise the NICE 20102 guidance as to severity of obstruction whereas in the initial publication there was still confusion around the change from the original 2004 chronic obstructive pulmonary disease (COPD) guidelines. As NICE 2010 now reflects GOLD 20203 this is less of a concern. The top ten tips (see Box 1)have been seen as a systematic approach to spirometry since the publication of the guidelines in 2013.
Spirometry interpretation can be numerical and give a pattern of airflow or it can be clinical when taken alongside history. In this article, it is purely the numerical interpretation that will be covered. It is recognised there is misdiagnosis in COPD in primary care, mainly due to poorly performed spirometry or misunderstanding of interpretation.4 This resultant misdiagnosis costs in both over prescribing in those who do not have a condition; or lack of prescribing for those who need it.
The inclusion of COPD in a patient record will double the cost of travel insurance and have far-reaching financial implications, such as affecting mortgages. This is not just a spirometric coding on a record it is a diagnosis and a life changing event for a person. This needs to be considered whenever it is undertaken. To ensure validity of the trace a process must be undertaken every time and the seven steps could be your solution to this.
The seven steps are as follows:
Demographics
Graphs
Number and quality
Reproducibility and reversibility
Ratio
Severity of obstruction
Clinical presentation and clinical picture
Demographics
Demographics are the first and fundamental part of a spirometry trace. The patient data should be recorded correctly as incorrect measurement will result in all the predicted values of the trace being invalid. Height, sex and age are the basis of the predicted values, whether using the European Community for Steel and Coal values (ECSC 1993)5 or more recent Global Lung Function Initiative 20126 the latter which incorporate ethnicity. The accuracy of height and age is a priority. Height should be recorded with no footwear and should not be taken from the previously recorded result on the template.
Graphs
Graphs, as a minimum both flow volume and volume time, should be shown on the trace and both should be considered in the interpretation of the accuracy of the trace. Although they show the same blow there are key features that can be seen differently. This is where faults such as a short blow, extra breath, cough, sub maximal effort, abrupt end and leaks around the mouthpiece can be seen. The presence of any of these would invalidate the trace and it should not go on to be intepreted.
Number and quality
Number and quality of blows should be checked to support the graphs and ensure that the correct number of attempts have been undertaken. There should be a minimum of three relaxed blows (vital capacity or slow vital capacity) and a minimum of three forced blows (forced vital capacity) which incorporates the Forced Expiratory Volume in 1 second (FEV1). All three should be reported as good quality and any that are reported as a short blow or poor effort are invalid. There can be a maximum of eight forced blows in any test.
Reproducibility and reversibility
Reproducibility and reversibility are separate issues but should be considered together in the context of the reason for the test.
Reversibility is seen as the degree by which the FEV1 changes in response to the administration of a short acting bronchodilator. The test is repeated and changes in FEV1 often reported in terms of negative or positive reversibility. This does not clearly determine what the disease is and there remains much confusion around this area. Guidelines vary between 200-400ml and knowledge
of the appropriate guidelines
is key.
However clinical history is fundamental. There are more pragmatic approaches such as pre and post treatment. All diagnostic spirometry should be post bronchodilator.
Reproducibility is a quality assurance check to see that the blows are the best the patient can do. Both tests pre and post bronchodilator should be of this standard if true reversibility is to be measured. If poor technique is undertaken on the first blows (pre bronchodilator) and then the patient understands what is required with the second part of the test (post bronchodilator) do you have reversibility or improved technique? The ARTP guidelines state the best two blows should be within 100ml or 5% of each other. This applies to the best two VC, best two FVC and best two FEV1. Post bronchodilator is where diagnosis is made and for this reason VC should be undertaken as well as FVC. Writing the blows down as they are undertaken is the best way to check reproducibility by calculating less than 100mls between tests. This becomes easier with experience.
The use of the 5% variation reading on the trace should be discouraged as in some machines the figure is the variation between the sum of the FVC and FEV1 and not the individual blows. The figure of 5% should only be used if mathematically calculated between blows or if the overall measure is less than a litre.
Ratio
Ratio is perhaps one of the most important yet misunderstood figures in basic spirometry interpretation. Simply put, it is the FEV1 divided into the FVC or VC whichever is the greater
A fixed ratio of 70% or 0.7 has been agreed by some guidelines to demonstrate obstruction so a ratio of 72% would be normal. However, in the those over 65 we should consider using lower limit of normal (LLN) for the ratio as again this is where misdiagnosis of obstruction is occurring in primary care. Some patients in their 70s and 80s can have a ‘normal’ ratio as low as 65% and still be normal. They are unlikely to have COPD and just have ageing lungs.
If the volumes were substantially reduced (below the LLN) and the ratio was above 70% this could indicate restriction. If all volumes
were reduced VC, FVC and FEV1) and the ratio reduced this could indicate a mixed pattern. These are all
patterns of airflow and not actual diagnoses.
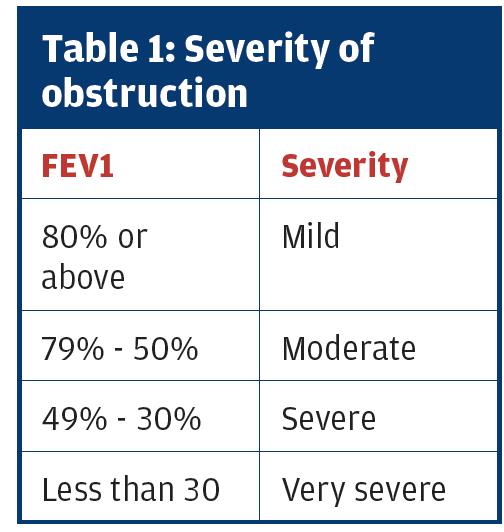
Severity of obstruction
This is another area of confusion. If obstruction is present, then the severity of that obstruction (not of COPD) is defined by using NICE2 or GOLD3 guidelines.
It is important to recognise that the FEV1 percent predicted is used to grade the severity of the obstruction – NOT the ratio. This is a common mistake.
Clinical presentation and the clinical picture
These are what determines the diagnosis. Post bronchodilator spirometry is what confirms or refutes this, but diagnosis is made by clear history taking. Spirometry alone cannot and should not give a diagnosis.Atopy is likely to mean asthma (eczema, hayfever, rhinitis) and smoking may indicate COPD but remember that only 20-25% of smokers develop COPD which means that 75-80% do not. Not everyone who smokes gets COPD and asthma does not become COPD.
Just as accurate spirometry needs training and competence to underpin it clinical history taking needs relevant asthma and COPD training and education to support accurate diagnosis.
While the seven steps has been put forward as a means to oversee a trace any systematic approach or crib sheet will help. What is important is a consistent approach that is interpreted in the light of the clinical history and patient presentation.
Chris Loveridge,
Director of Inspirometry Training and Consultancy Limited
References
1. Primary Care Commissioning: A guide to performing quality assured diagnostic spirometry. 2013. Available online: www.pcc-cic.org.uk/article/guide-quality-assured-d... (accessed January 2020)
2. Chronic obstructive pulmonary disease in over 16s: diagnosis and management. NICE guideline [NG115] Published date: December 2018 Last updated: July 2019 https://www.nice.org.uk/guidance/NG115 Accessed February 2020
3. 2020 Global Strategy for Prevention, Diagnosis and Management of COPD https://goldcopd.org/pocketguidereferences/gold-20... Accessed February 2020
4. Strong M, Goyder E, Lee ACK, et al. Accuracy of diagnosis and classification of COPD in primary and specialist nurse-led respiratory care in Rotherham, UK: A cross-sectional study. Primary Care Respir J 2014. 23(1): 67-73
5. Quanjer PH, Tammeling GJ, Cotes JE, Pederson OF, Peslin R, Yernault J-C. Lung volume and forced ventilatory flows: report working party standardization of lung function tests, European Community for Steel and
Coal. Official statement of the European Respiratory Society. Eur Respir J 1993 6(Suppl 16): 5-40
6. Quanjer PH, Stanojevic S, Cole TJ, et al and the ERS Global Lung Function Initiative. Multi-ethnic reference values for spirometry for the 3-95 years age range: the Global Lung Function 2012 equations. Eur Respir J 2012 40: 1324-43